


 Share on media
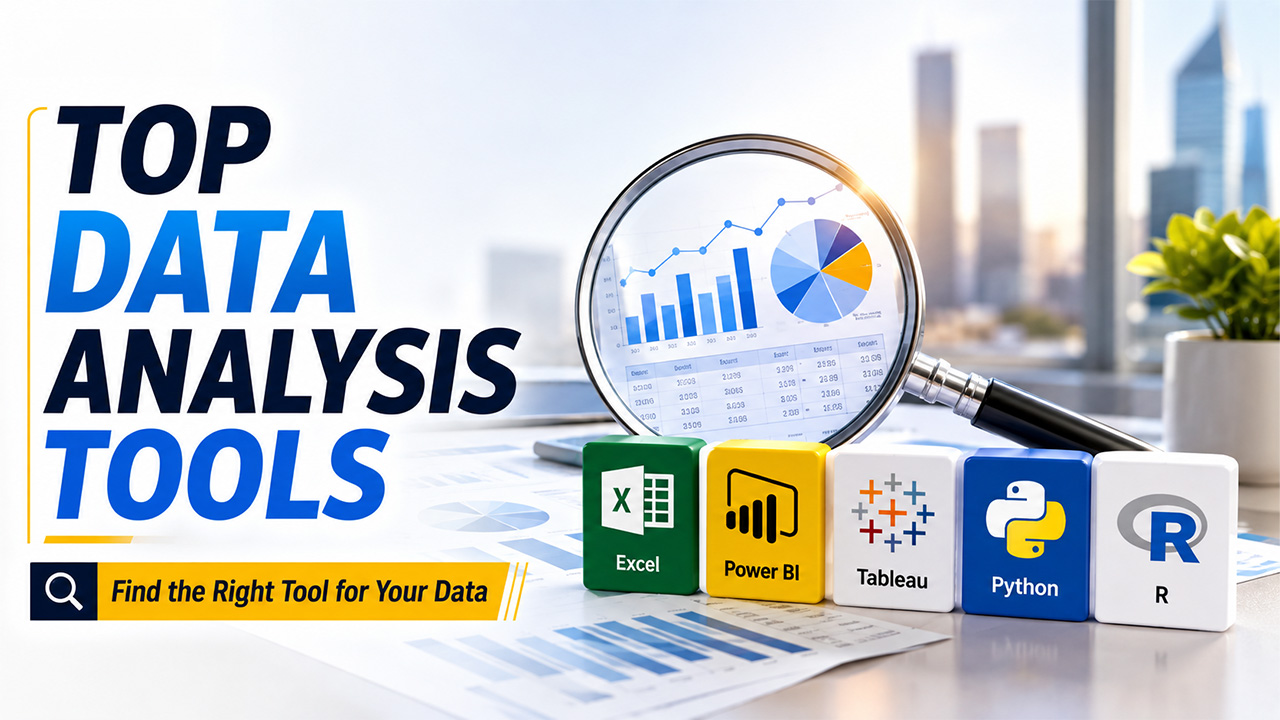


The guide explores some of the best data analysis tools, suited for every type of business and analyst, and also explores what makes each tool useful in 2026.
With the growing digital landscape, data has become one of the most valuable assets for modern businesses. Organizations rely on data analysis, from understanding customer behavior to forecasting sales, to making faster and more informed decisions. But the main problem is businesses face various challenges in processing the data, from collecting to organizing and interpreting. Businesses generally require specialized tools to collect, clean, organize, visualize, and interpret data.
In the recent few years, the data analysis landscape has moved beyond spreadsheets and traditional tools. Businesses utilize intelligence platforms, statistical software, programming languages, cloud analytics solutions, and AI-powered tools to efficiently manage customer data.
What are Data Analysis Tools
Data analysis tools are a type of software program, platform, or programming technology that helps users collect, organize, clean, examine, and understand data. The platform can turn raw data, such as sales figures, customer information, website traffic, or financial records into useful insights that can support better decision-making. For businesses, data analysis tools can help identify which products sell the most, which regions can generate the highest revenue, how sales change over time, and where performance is declining.
What Can Data Analysis Tools Do?
Most of the data analysis tools can help businesses with a wide range of data-related tasks, such as:
- Data Cleaning: It helps find and correct missing, duplicate, or incorrect data.
- Data Organization: It can structure information for efficient analysis.
- Data Visualization: Creates charts, graphs, and dashboards to make trends easier to understand.
- Statistical Analysis: It can find relationships, patterns, averages, correlations, and other key statistical insights.
- Reporting: It can turn analysis into reports that businesses and teams can use.
- Forecasting: Data analysis tools use historical information to estimate future trends.
- Automation: It reduces repetitive manual analysis and reporting tasks.
Key Benefits of Data Analysis Tools
Data analysis tools offer key benefits to businesses and analytics, especially in turning raw data into useful information. The tools help automate calculations, identify patterns, and present results visually, making it easier to understand what is happening and make informed decisions.
Some of the key benefits of using data analysis tools are as follows:
- Better Decision Making
The program offers the ability to make data-driven decisions. Instead of relying solely on assumptions or intuitions, businesses can efficiently examine actual data to understand trends, customer behavior, sales programs, and operational results.
- Saves Time and Efforts
Data analysis tools can automate large datasets, such as calculations, data cleaning, reporting, and dashboard updates. This allows analysts to spend more time interpreting results and solving business problems.
- Improves Data Accuracy
Performing manual calculations and repetitive data entry can often lead to mistakes. Using automated formulas, queries, and analytical processes can reduce human errors and produce more consistent results.
- Identify Trends and Patterns
Data analysis tools can uncover relationships and patterns that cannot be obvious while examining raw data. Businesses can use these insights to identify changing customer preferences, product trends, seasonal demands, and areas of poor performance.
Top 5 Data Analysis Tools
Ideal data analysis tools help automate calculations, identify patterns, and present results visually. These tools make it easy for the user to understand what is happening and make informed decisions.
Some of the most popular and useful data analysis tools are listed below:
Microsoft Excel
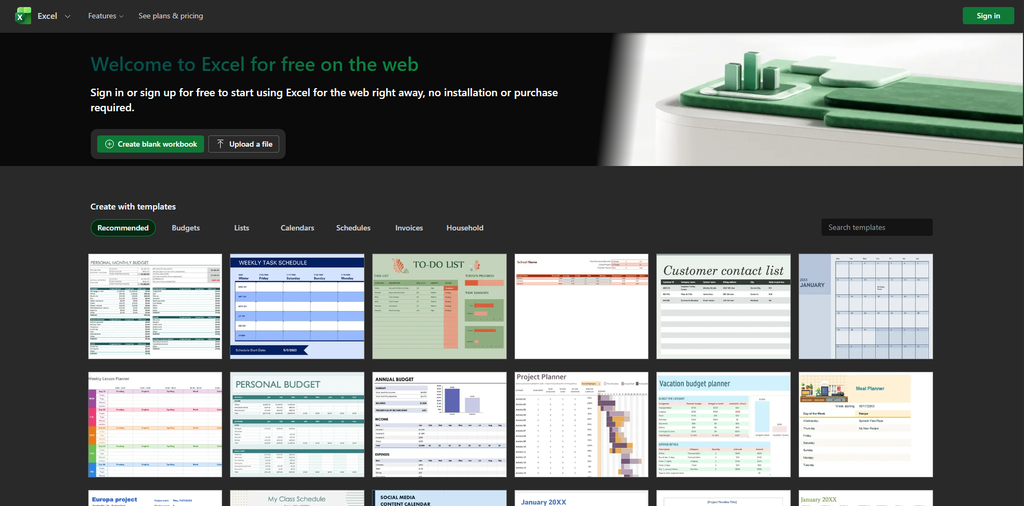
Microsoft Excel is among the most popular, accessible, and versatile tools for data analysis. The platform offers key features, such as PivotTables, formulas, data models, and Power Query, that ensure easy connection and transfer of data from different sources.
Key Features
- Formulas and functions for calculations.
- PivotTables and PivotCharts.
- Charts and data visualization.
- Power Query for data import and transformation.
Limitations
- It can become difficult to manage very large or highly complex datasets.
- Complex spreadsheets can be difficult to maintain.
Ideal For
- Small-to-medium datasets
- Financial analysis
- Budgeting
- Reporting
- Business calculations
- Quick exploratory analysis
Microsoft Power BI
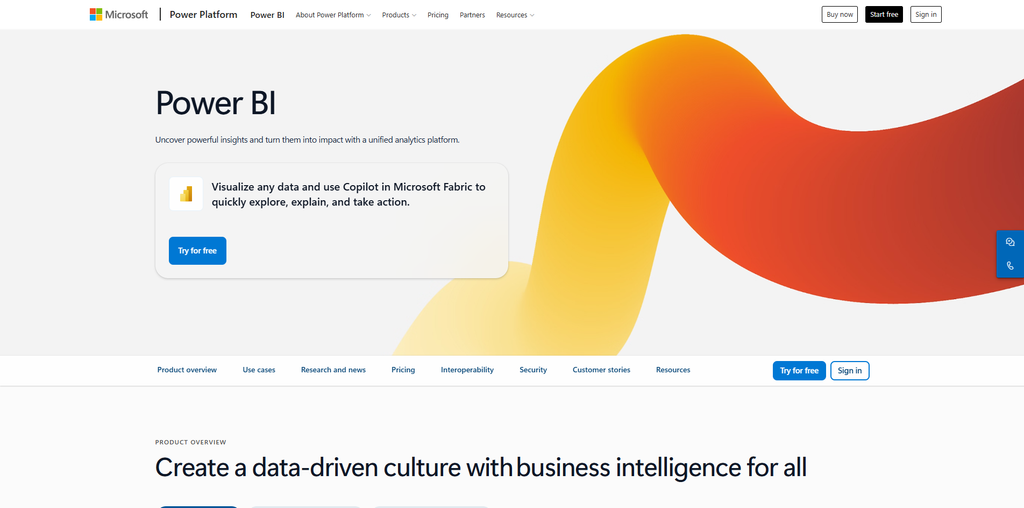
Microsoft Power BI is a business intelligence and analytics platform that is designed to connect data from multiple sources and turn it into interactive reports and dashboards. The platform supports data transformation through Power Query, data modeling with DAX, numerous visualization options, sharing and collaboration, and AI-assisted capabilities through Copilot.
Key Features
- Interactive dashboards and reports.
- Multiple data source connections.
- Power Query for data preparation.
- DAX for calculations and data modeling.
Limitations
- Advanced features can require a learning curve.
- Complex data models may require specialized skills.
Ideal For
- Business intelligence
- Management dashboards
- KPI monitoring
- Sales reporting
- Financial analysis
- Enterprise decision-making.
Tableau
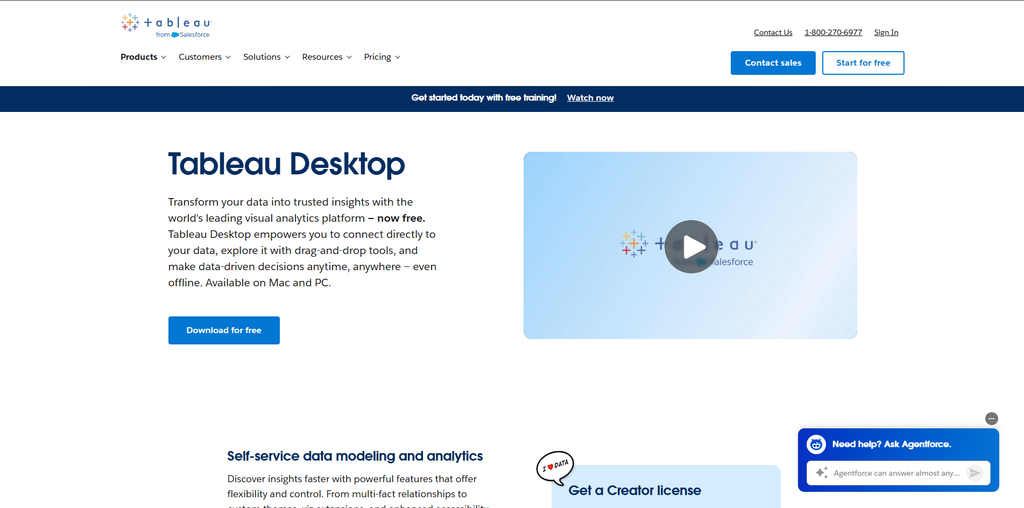
Tableau is a data visualization and business analytics platform that mainly focuses on helping users explore information visually. The platform can make complex datasets easier to understand through interactive visual analysis.
Key Features
- Interactive dashboards.
- Drag-and-drop visual analysis.
- Numerous chart and visualization options.
Limitations
- Advanced functionality can take time to learn.
- Licensing can be expensive for some small businesses.
Ideal For
- Data visualization
- Executive reporting
- Business intelligence
- Marketing analytics
- Sales analysis
Python
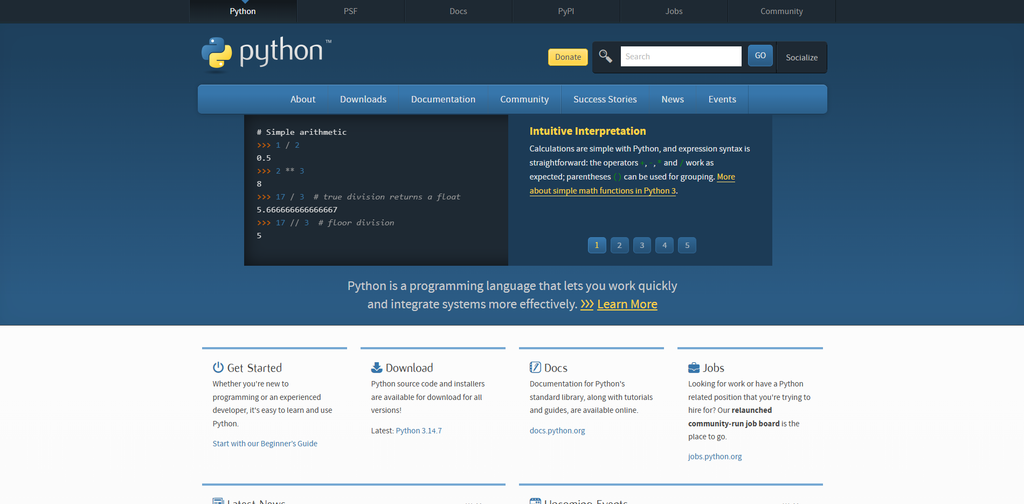
Python is a programming language that is widely used for data analysis, data science, automation, and machine learning. The platform offers analysts significant control over how data is processed and analyzed.
Key Features
- Powerful data manipulation and processing.
- Extensive analytics libraries.
- Data visualization capabilities.
- Statistical analysis.
Limitations
- Requires programming knowledge.
- Has a steeper learning curve for beginners.
Ideal For
- Advanced data analysis
- Automation
- Data science
- Machine learning
- Large datasets
- Customized analytical workflows
R Project
R Project is a programming language and environment that is designed especially for statistical computing and data visualization. That platform is widely used by analysts and researchers who need sophisticated statistical techniques.
Key Features
- Advanced statistical analysis.
- Statistical modeling.
- Data visualization.
- Forecasting and predictive analysis.
Limitations
- Requires programming knowledge.
- Can be challenging for beginners.
Ideal For
- Statistical analysis
- Academic research
- Forecasting
- Experimental analysis
- Advanced analytics
Choosing the Right Data Analysis Tools
The most important factor when choosing the right data analysis tool for the business may differ. A tool that performs well for a small business might not be suitable for a large organization. While choosing data analysis tools for business, users need to consider the following factors:
- Identify Business Goals
Users should determine what they actually want to achieve with data analysis. For instance, Excel might be considered ideal for basic financial reporting, while Power BI or Tableau may be better for an interactive business dashboard.
- Consider Data Size
The amount of data that a business works with can significantly influence the choice of data analysis tools. Smaller datasets can be handled efficiently with spreadsheet applications, whereas large and complex datasets require databases, cloud analytics platforms, or programming-based tools. Businesses working with large databases should also consider database optimization improving query performance, reducing latency, and supporting scalable data workflows.
- Evaluate Technical Skills
Different tools require different levels of technical knowledge. The user should choose a tool the team can easily learn and use.
- Evaluate Visual Capabilities
If the organization regularly creates data for managers, clients, or executives, having visualization capabilities can be essential. Platforms like Power BI and Tableau can help users understand trends and key performance indicators without having to examine raw datasets.
Conclusion
The right data analysis tools can help businesses turn complex information into actionable insights, improve decision-making, save time, and uncover new opportunities. These solutions range from spreadsheets and programming languages to business intelligence platforms, big-data frameworks, and AI-powered analytics. Alongside these options, Data Integration Tools help organizations bring information together from different sources, making it easier to analyze data in one place. As data volumes continue to grow, choosing the right tools can give businesses a stronger competitive advantage.
Frequently Asked Questions :
Why are data analysis tools important for businesses?
Data analysis tools are a type of software program that helps businesses make data-driven decisions, identify trends, improve operational efficiency, and understand customer better. It also enables businesses to reduce errors and discover new business opportunities.
Which data analysis tool is best for beginners?
For beginners, Excel is generally considered a good starting point, as it offers a familiar spreadsheet interface and relatively accessible formulas and visualization features.
Which data analysis tool is best for large datasets?
For larger datasets, Python can be considered ideal, as it can handle substantial datasets and advanced workflows.
Can data analysis tools improve decision-making?
Yes, data analysis tools can help improve decision-making. The platform helps businesses analyze historical and current data, identify trends and patterns, monitor performance, and generate insights.